

High-quality data is crucial for business success. Esri has long understood this and has made data provisioning a central element of its business. With all kinds of data being foundational and accessible through ArcGIS, users are never lacking when they need to conduct detailed analyses that support decision-making.
Among the many data offerings from Esri, demographic data is at the core. Organizations rely on this data to gain a more detailed understanding of the population, discover growth trends in relation to housing, income, age, and several other socioeconomic characteristics. The process of delivering this data requires meticulous data sourcing and cleaning methods to ultimately ensure accuracy and a close-to-real-world representation of facts.
Esri’s Chief Demographer, along with a team of data experts, leads the mission to provide users with reliable and up-to-date US-based demographic data that can easily be discovered and used within the ArcGIS system. This data can also be visualized with a wide array of basemaps or integrated into the users’ own systems to support their analyses.
In this interview, Kyle Cassal provides insight into the work that goes into creating one of Esri’s core data products, , and explains why high-quality data is the bed rock of high-impact decisions.

Could you please introduce yourself and explain your role at Esri? When did you join the team, and how has your role evolved over time?
My name is Kyle Cassal, and I began my tenure at Esri in 2009 as an analyst in the Data Development Team. In 2017, I transitioned into the position of Chief Demographer. In my current capacity, I am responsible for developing and supervising innovative statistical models and methodologies for US-based demographics. Additionally, I communicate research outcomes effectively to our clients and actively collaborate with different Esri teams to smoothly integrate our data into various Esri products.
Esri is known for delivering world-class services, including the integration of multiple data sources and a rigorous vetting process for authoritative data. In your opinion, what sets Esri’s data products and location services apart from those offered by other companies?
Esri’s Data Development Team has a has a rich track record in developing detailed high quality neighborhood level data about people, places and behaviors. Our portfolio includes cutting-edge databases such as Consumer Spending, Market Potential, and ArcGIS Tapestry, which have set industry benchmarks. We consistently enhance our data collection to meet the dynamic requirements of our clients. With a meticulous approach, our team generates more than 14,000 variables across 29 geographic levels, resulting in the annual delivery of over 37 billion data elements.
Your products, such as Updated Demographics, are regularly updated. How do you and your team manage the influx of new data and ensure its integration into the services?
Our team sources data from carefully selected specialized vendors and public sources. Prior to integration, the data undergoes thorough quality assessments to ensure accuracy, completeness, and consistency. We maintain database systems that facilitate swift retrieval and processing. Various teams collaborate to integrate our data into Esri products like ArcGIS Business Analyst, ArcGIS GeoEnrichment service, and ArcGIS Living Atlas, enabling users to access the data for analysis, visualization, and decision-making. Our primary databases undergo an annual update in June, with supplementary updates following the ArcGIS Online update schedule throughout the year.
When developing these data products, what is the most significant challenge you encounter, and how do you overcome it?
Our data products are constructed using proprietary statistical models that incorporate both public and private data inputs. Assessing the inherent error and bias within each data input can be complex. However, we use data analysis techniques to ensure that we are using the highest quality data for any given level of geography and adjusting for outliers.
How do you ensure the accuracy of the data products you create?
Assessing the accuracy of demographic data is a meticulous process with its own scientific methodology. Normally, demographic estimates are compared against the decennial census count, which provides a comprehensive population count. Through these decennial assessments, we can analyze bias, allocation errors, and precision across different geographic scales and growth parameters. Esri has conducted and published studies based on 2010 and 2020 data, demonstrating that our data quality exceeds that of other commercial and public sources for smaller geographic areas.
How crucial is high-quality data for the work that Esri customers do?
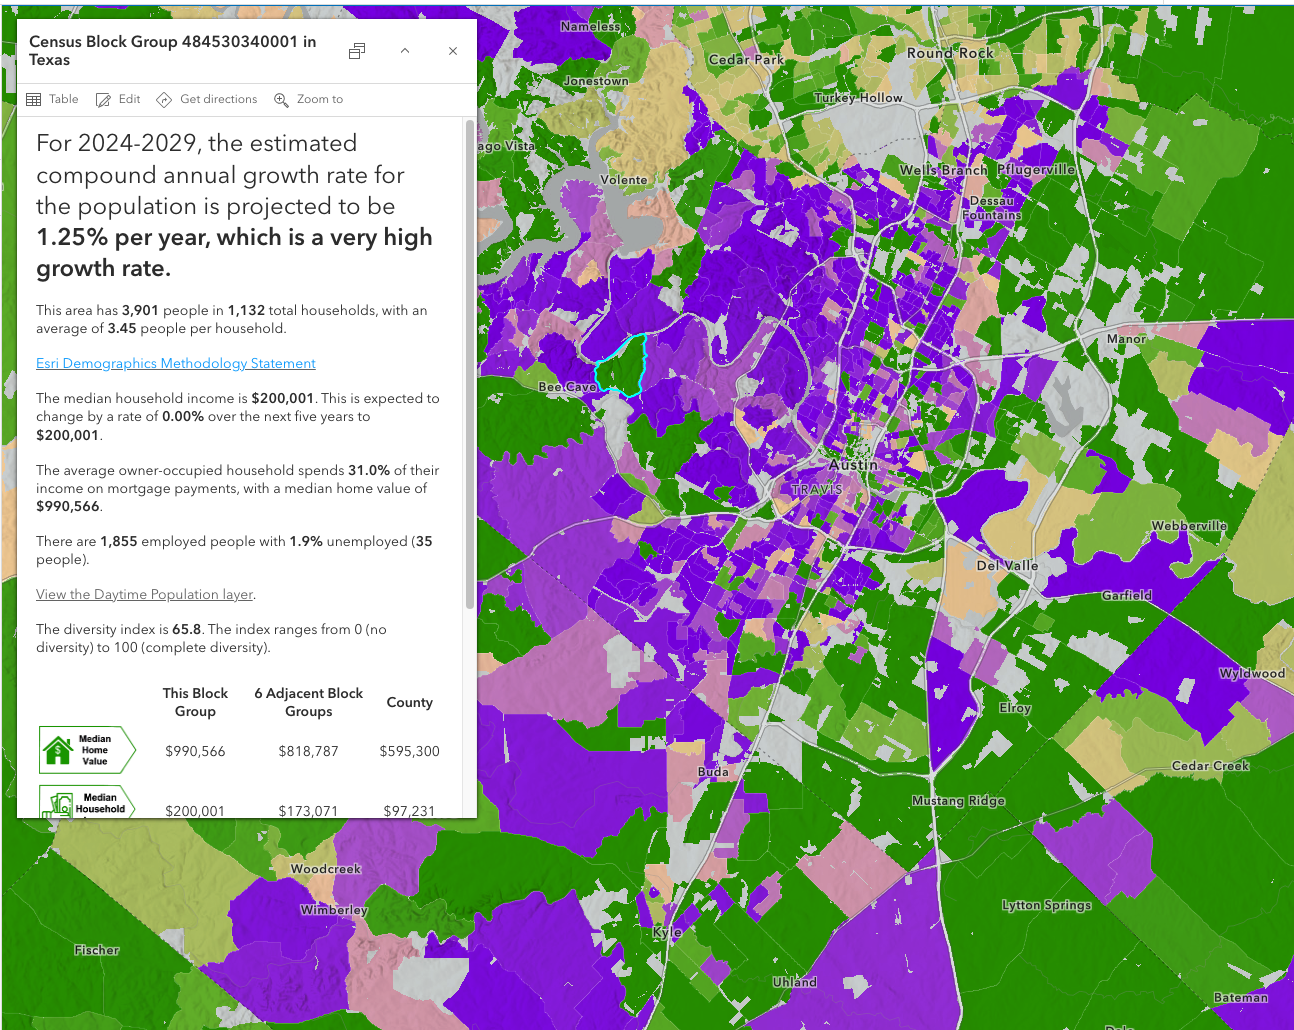
Accurate and accessible demographic data of high quality are essential for targeted marketing, site selection, urban planning, resource allocation, and thorough analysis. Our demographic and socioeconomic data are designed to support informed decision making at the neighborhood level.
What advice would you give to users or organizations when searching for or working with demographic data?
To enhance their utilization of Esri’s data, users are encouraged to engage with our documentation. This includes comprehensive methodology statements, data tutorials, and informative blogs. These resources promote best practices while highlighting the utility and limitations of the data.
![]()
What motivates you and your team to continuously strive for excellence in your work?
The Data Development Team is inspired by the extensive user base of individuals and organizations leveraging Esri data for daily informed decision-making. This commitment motivates our team to consistently enhance and broaden our data portfolio. Our focus is on enabling these users to enhance their performance and mitigate risks effectively.
Can you share any updates or improvements that you and your team are currently working on or planning to make in the near future to enhance the quality and functionality of your data and location services?
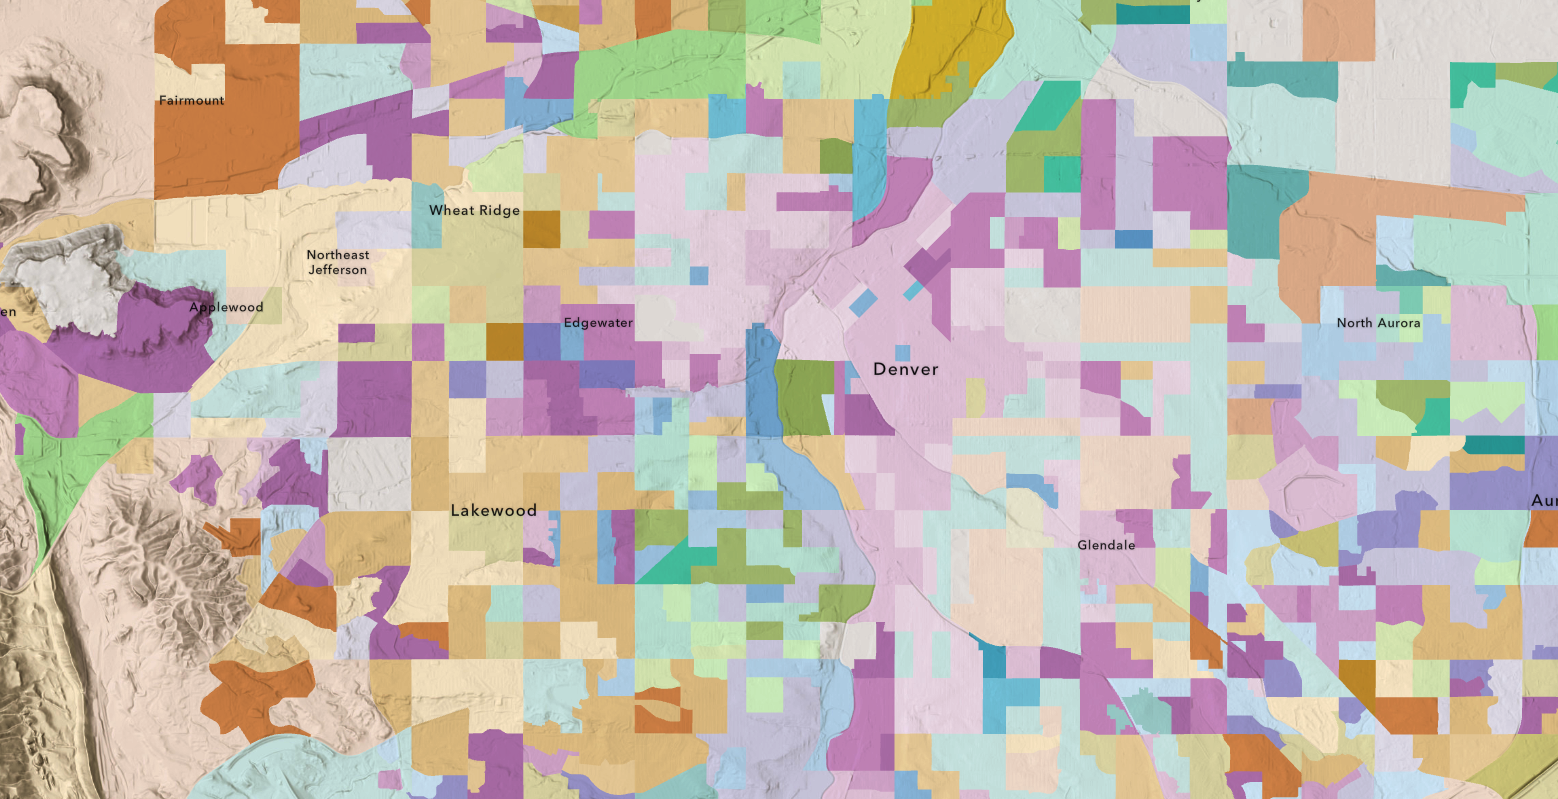
This June, our team is set to launch the latest iteration of ArcGIS Tapestry, introducing the next generation of this dataset. ArcGIS Tapestry categorizes residential areas into segments defined by shared demographic, socioeconomic, and lifestyle attributes. This updated version features 60 distinct neighborhood types, with 33 segments remaining unchanged from the previous edition of Tapestry, and 27 newly identified segments reflecting the evolving fabric of American neighborhoods.
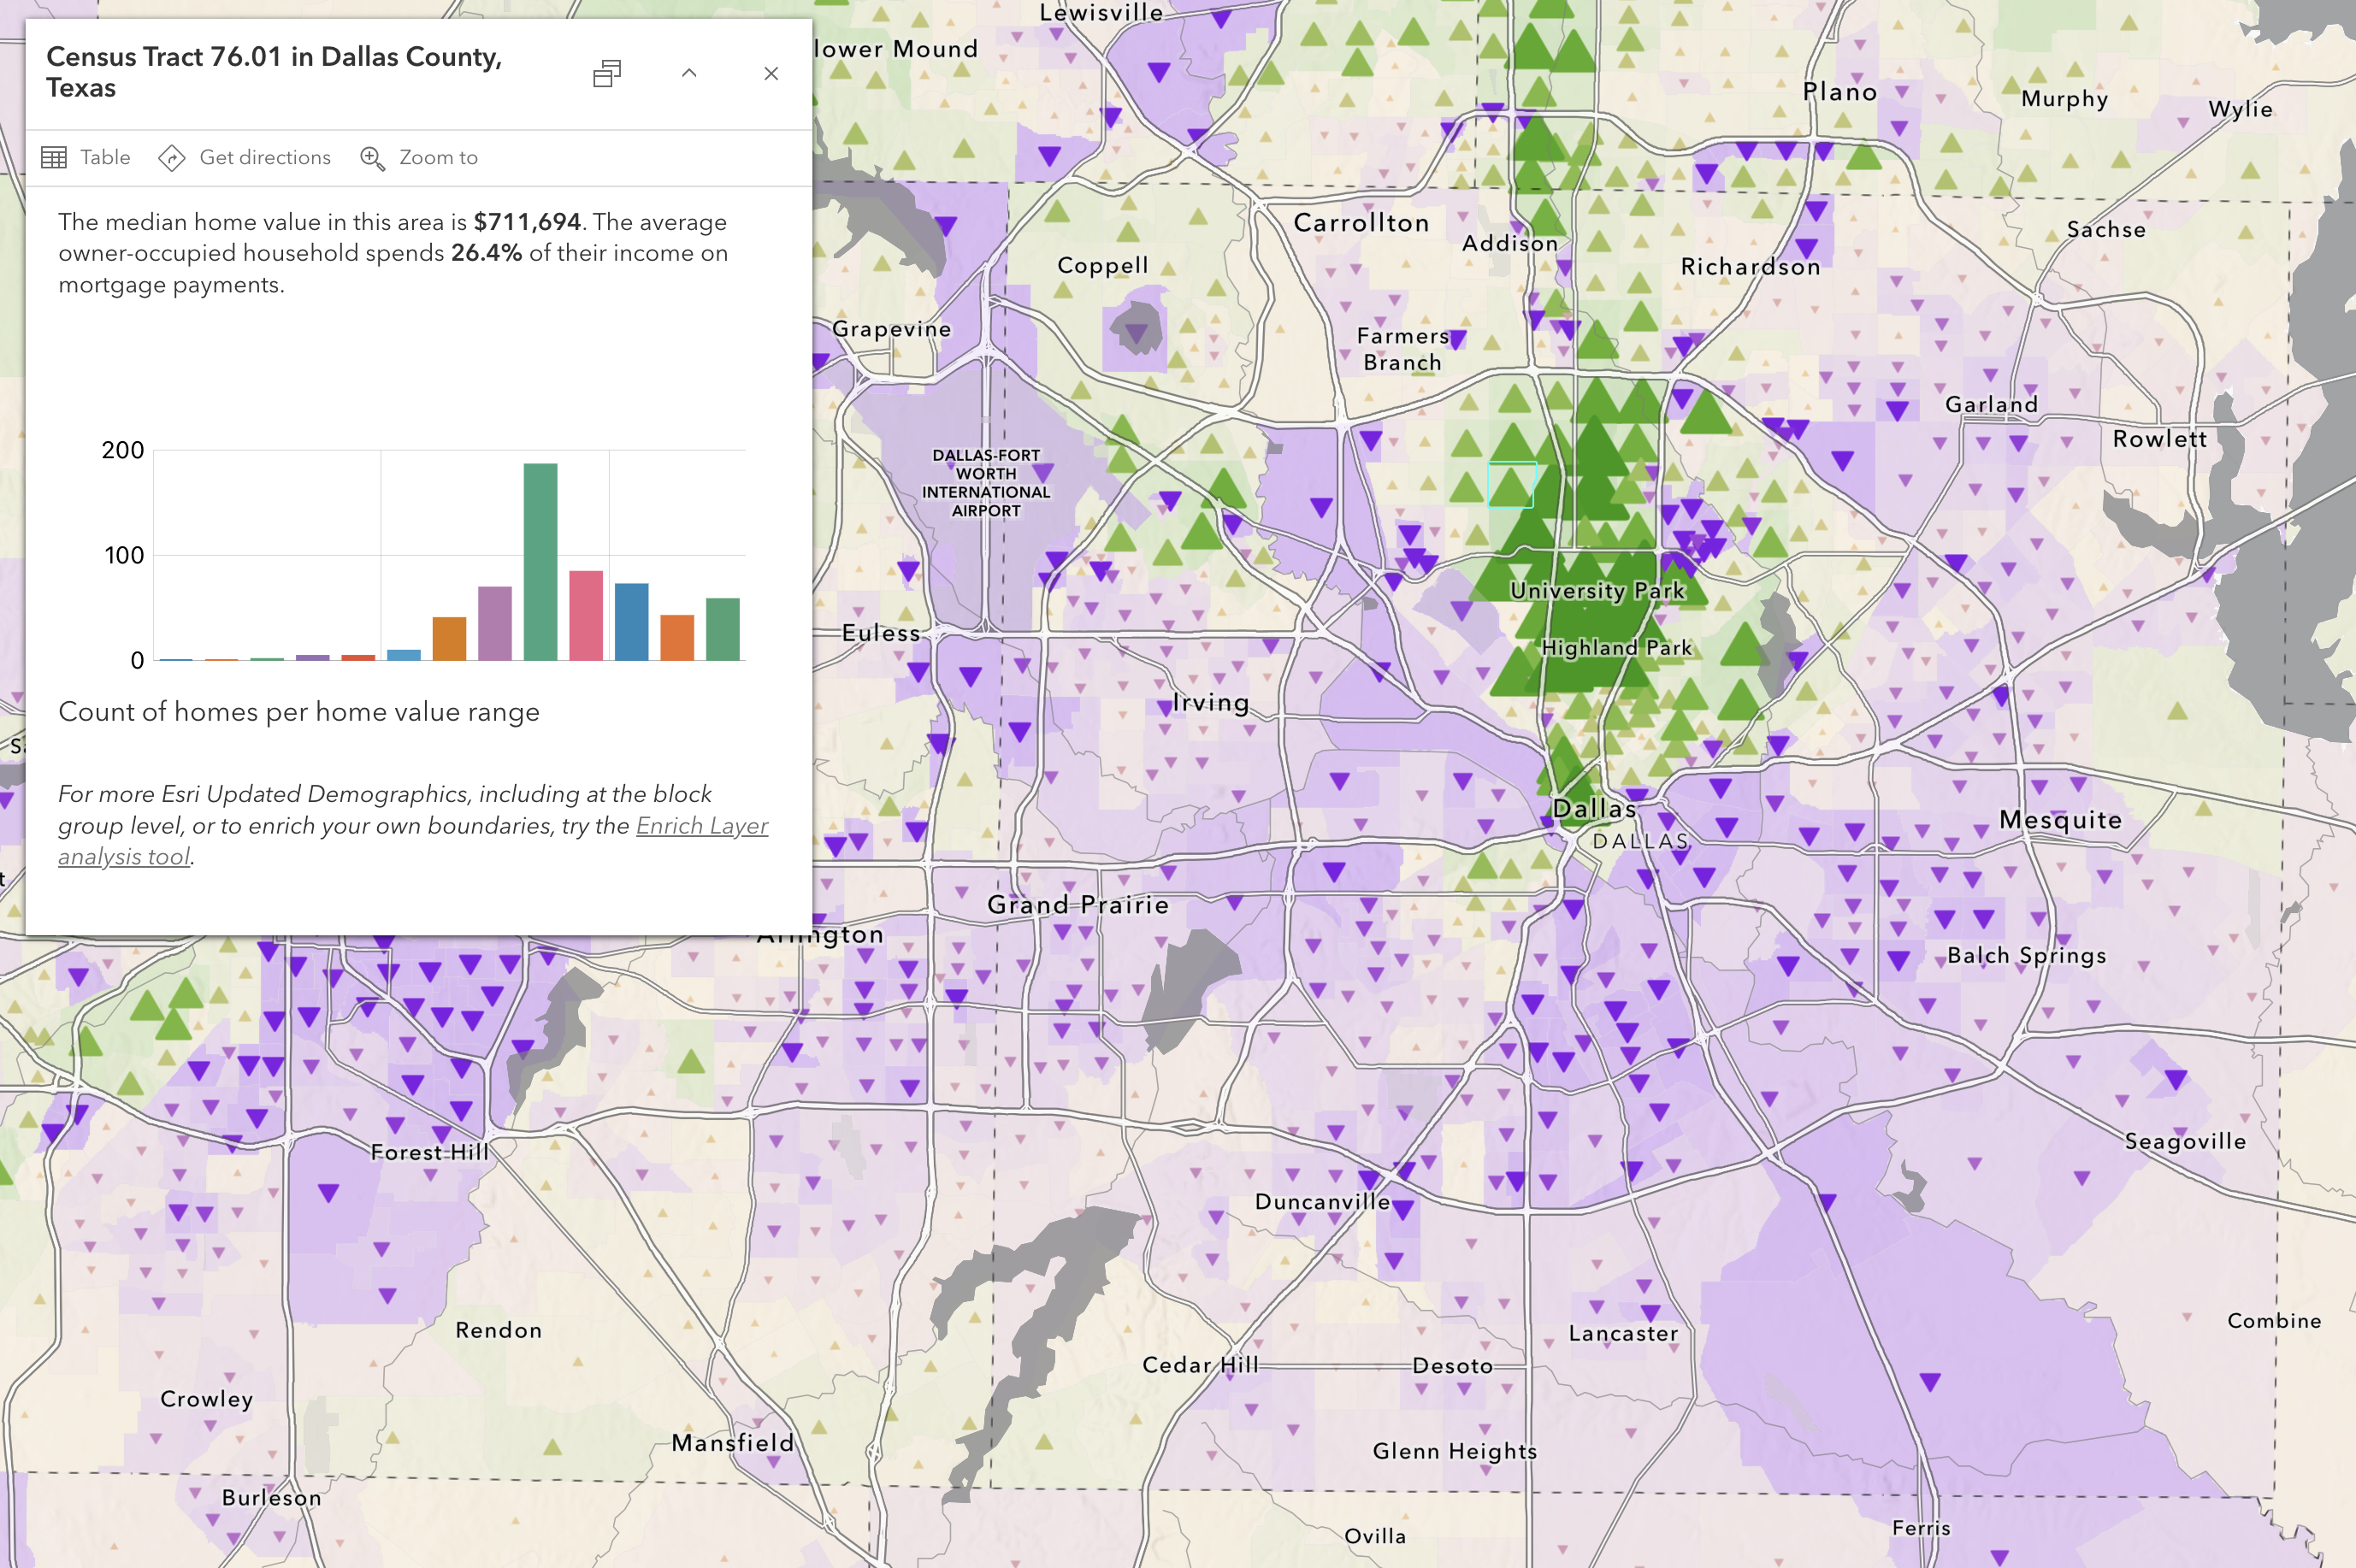
In addition, we have responded to market demand by expanding our estimates of households by income from 9 to 20 intervals. Previous estimates were top coded at 200+ thousand dollars. Our new estimates now extend the highest interval to 500+ thousand dollars. Similarly, we have expanded our estimates of home value from 13 to 26 intervals and contract rent from 12 to 24 intervals. This increased resolution will better capture current trends and increase analysis capabilities.
To learn more about demographic data offerings from Esri, please visit the website. Purchase demographic data files directly from the Esri Store and explore how you can access demographic data through ArcGIS.
Explore resources on how to get started with Esri Demographics and stay updated on new releases.

Elizabeth Ole
Elizabeth is a passionate storyteller and marketer who enjoys utilizing her expertise in creativity, marketing, and technology to craft compelling brand and product stories.


